.svg)


Landing a remote or hybrid data job requires proving you understand data architecture, modeling, and performance optimization. Hiring managers use specific data warehouse interview questions to test these exact skills and find qualified candidates. This guide is your playbook for navigating those technical interviews with confidence.
We break down the most common and challenging questions you will face, from foundational concepts like star schemas to advanced performance tuning. Each section provides expert model answers and practical examples to help you articulate your experience. Mastering these topics shows you have the expertise needed to pass technical screens and secure your next role in analytics or business intelligence.
This guide covers everything from ETL processes to designing a data warehouse from scratch. While technical skill is vital, remember to prepare for common behavioral interview questions, as they reveal your problem solving approach and team fit.
Our goal is to give you actionable insights for interview success. We will also show you how to ensure your resume, tailored with Jobsolv’s free ATS approved resume builder, effectively highlights these skills to get you noticed. By the end of this article, you will be prepared to demonstrate your value and land the remote data job you want.
1. What is a Data Warehouse and How Does It Differ from an Operational Database?
This is a common foundational question. Interviewers use it to gauge your core understanding of data architecture. A strong answer shows you grasp the fundamental "why" behind data warehousing, not just the "what."
A data warehouse is a central repository of integrated data from one or more sources. It stores current and historical data in a single place. It is designed specifically for querying and analysis, acting as the backbone for Business Intelligence (BI) and reporting.
Key Differences: OLAP vs. OLTP
The main distinction is the system's purpose. Data warehouses are Online Analytical Processing (OLAP) systems. Operational databases are Online Transactional Processing (OLTP) systems.
- Operational Databases (OLTP): These systems run day to day business operations. Think of an e-commerce site's database that processes customer orders. It handles many users performing fast, small transactions like
INSERT,UPDATE, andDELETE. Its priority is speed and data integrity for transactional tasks. - Data Warehouses (OLAP): These systems are built for complex queries that analyze historical data. Instead of single transactions, an analyst might query an OLAP system to find "total sales of product X in the Northeast region for the last five years." The priority is read heavy query performance over large datasets.
Pro Tip: Structure your answer by first defining each system. Then, compare their core purpose, data structure (normalized for OLTP vs. denormalized for OLAP), and typical workload.
To excel, you can also mention how modern architectures are evolving. Exploring the differences between data lakehouse and data warehouse architectures can provide a more detailed understanding to share. This knowledge is valuable as many organizations adopt hybrid models. For more examples, review these common data analyst interview questions.
2. Explain the Difference Between a Star Schema and a Snowflake Schema
This is a classic technical question that tests your understanding of dimensional modeling. Interviewers ask this to see if you grasp the trade offs between query performance and data redundancy. A clear answer demonstrates your ability to design efficient data structures for analytics.
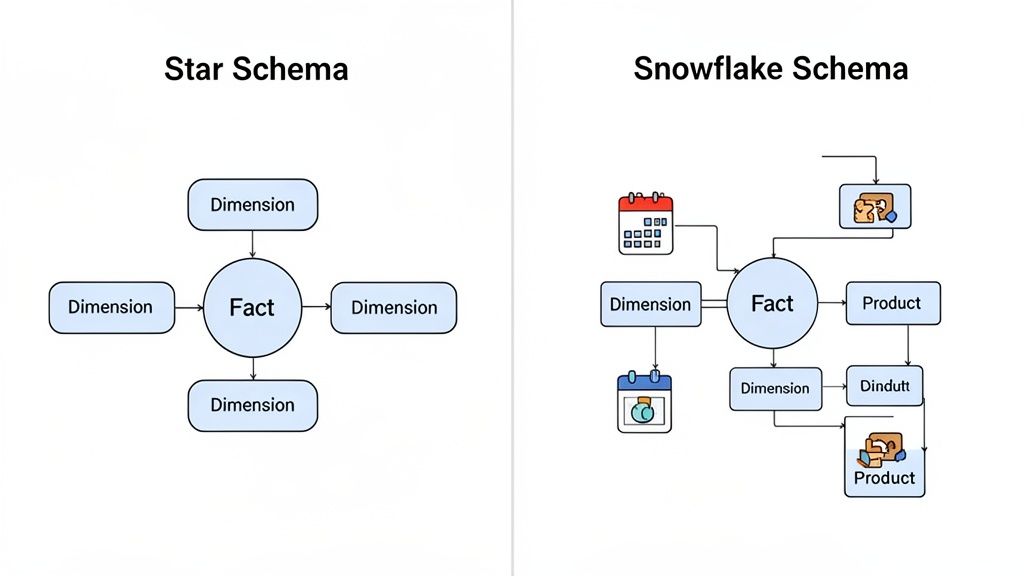
Both schemas organize data in a data warehouse. They consist of a central fact table surrounded by descriptive dimension tables. The key difference is how normalized the dimension tables are. A star schema is denormalized, while a snowflake schema is normalized.
Key Differences: Denormalization vs. Normalization
The choice between these schemas impacts query complexity and data maintenance.
- Star Schema: This is the simplest and most common design. A central fact table connects directly to several dimension tables. The dimension tables are denormalized, meaning all attributes for a dimension are in a single table. This design leads to faster queries because it requires fewer joins, making it ideal for most BI and analytics use cases.
- Snowflake Schema: In this design, the dimension tables are normalized. This means a dimension table can link to other dimension tables, creating a branching, snowflake like shape. For example, a
Dim_Producttable might link to aDim_Product_Categorytable. This reduces data redundancy but increases the number of joins required for queries, which can slow them down.
Pro Tip: When answering, draw a simple diagram on a whiteboard if you can. Start with a star schema showing a single fact table and its dimensions. Then, show how a snowflake schema "snowflakes" a dimension (like
ProductintoProductandCategory) to illustrate normalization.
Choosing the right model depends on business needs. For more guidance on creating effective data structures, review these 10 data modeling best practices to land your next remote analytics job. Mentioning that modern cloud data warehouses can often handle the join complexity of snowflake schemas with little performance impact will show you are up to date.
3. What is a Fact Table and a Dimension Table? Provide Examples.
This question tests your understanding of dimensional modeling, a core design principle for most data warehouses. Your ability to distinguish between facts and dimensions shows that you can structure data for reporting and business intelligence.
In dimensional modeling, a fact table contains the measurements, metrics, or facts of a business process. It stores quantitative, transactional data. A dimension table contains the descriptive attributes that provide context to the facts. These tables store the qualitative data that describes "who, what, where, when, and why" an event occurred.
Key Differences: Quantitative vs. Qualitative Data
Fact tables store what you measure, while dimension tables store what you measure by.
- Fact Tables (The "What"): These tables are deep and narrow, with millions or billions of rows. They primarily consist of foreign keys pointing to dimension tables and numeric measures. For example, in an e-commerce model, a
fact_salestable would containorder_id,product_key,customer_key,date_key,quantity_sold, andsale_amount. - Dimension Tables (The "Who, Where, When"): These tables are wide and shallow, with far fewer rows than fact tables. They contain descriptive, textual attributes. For instance, a
dim_customertable would have columns likecustomer_key(primary key),customer_name,address,city, anddemographic_segment.
Pro Tip: Use an industry specific example relevant to the company. Explain that facts are numeric business events (e.g., sales, clicks), while dimensions are the descriptive context (e.g., products, users, dates). Mentioning that dimension tables are denormalized to improve query speed by reducing joins will impress the interviewer.
To show advanced knowledge, discuss the importance of surrogate keys in dimension tables. For a deeper understanding of how these concepts are applied, reviewing how different data warehouse tools handle these structures can provide valuable talking points.
4. Explain the ETL Process. What are its Challenges and How Do You Handle Them?
This question is a staple in data warehouse interviews. ETL (Extract, Transform, Load) is the engine that powers a data warehouse. Interviewers use this prompt to evaluate your practical understanding of data pipelines, data quality, and problem solving skills.
ETL is a three phase process used to move data from various sources into a data warehouse. First, data is Extracted from source systems like databases or APIs. Next, it is Transformed to fit the required model; this involves cleansing, standardizing, and enriching the data. Finally, the processed data is Loaded into the target data warehouse.

Common Challenges and Solutions
A strong answer goes beyond definitions and addresses real world complexities of building ETL pipelines.
- Data Quality and Consistency: Source data is often messy, with duplicates, nulls, or inconsistent formats. Solution: Implement automated data validation checks and cleansing rules during the transform stage. Use a data quality monitoring system to catch anomalies early.
- Scalability and Performance: As data volume grows, ETL jobs can become slow. Solution: Optimize transformations by using incremental loading instead of full reloads. Use distributed processing frameworks and partition large datasets to improve performance.
- Dependency Management: ETL pipelines often have complex dependencies. Solution: Use an orchestration tool like Apache Airflow to define, schedule, and monitor workflows. This ensures jobs run in the correct order and provides ways to handle retries and failures.
Pro Tip: When answering, use the STAR method (Situation, Task, Action, Result) to describe a specific ETL challenge you have faced. Detail the tools you used, the monitoring you implemented, and the positive outcome of your actions.
Your ability to articulate these challenges and solutions shows you have hands on experience. To develop these skills, it helps to understand how to build a data pipeline from scratch. You can learn how to build a data pipeline to gain practical experience that will impress hiring managers.
5. What is a Slowly Changing Dimension (SCD)? Explain Types 1, 2, and 3.
This is a critical topic in data warehouse interviews. It tests your knowledge of dimensional modeling and managing data that changes over time. A clear answer shows you can design data models that preserve historical context for accurate analysis.
A Slowly Changing Dimension (SCD) is a dimension that stores and manages both current and historical data in a data warehouse. It applies when attribute values for a record change infrequently, like a customer's address or a product's price.
Key SCD Types: 1, 2, and 3
The main difference between SCD types is how they handle historical data when a change occurs.
- SCD Type 1: This method overwrites old data with new data and does not track history. It is used when historical values are not important, such as correcting a spelling error in a name.
- SCD Type 2: This method tracks history by creating a new record for each change. The dimension table uses versioning columns like
start_date,end_date, and acurrent_flagto identify the active record. This is the most common approach because it preserves the full history. - SCD Type 3: This method tracks limited history, often only the "previous" value, by adding a new column. For instance, a
previous_sales_repcolumn could track the prior representative. This method is less common as it is not easily scalable.
Pro Tip: When explaining SCD Type 2, be sure to mention the role of a surrogate key. This unique identifier is essential because the natural key (e.g.,
EmployeeID) will be duplicated for each historical version of a record. The surrogate key ensures each row remains unique.
To elevate your answer, discuss implementing SCD Type 2 using MERGE statements in SQL. You can learn more about how data pipelines power these transformations, providing a more complete picture of the process. You can also review common ETL developer interview questions which often cover SCD details.
6. How Would You Optimize Data Warehouse Query Performance?
This practical question tests your knowledge of performance tuning. Answering this well shows you can manage large scale data systems. Your response should detail the "what," "why," and "when" for each optimization technique.
Query optimization is the process of improving the speed and efficiency of data retrieval. As data volumes grow, a query that runs in seconds on a small dataset can take hours. Optimization is essential for usable analytics and BI dashboards. Core strategies involve reducing the amount of data the system needs to scan.
Key Optimization Techniques
A strong answer breaks down the primary methods for improving query performance.
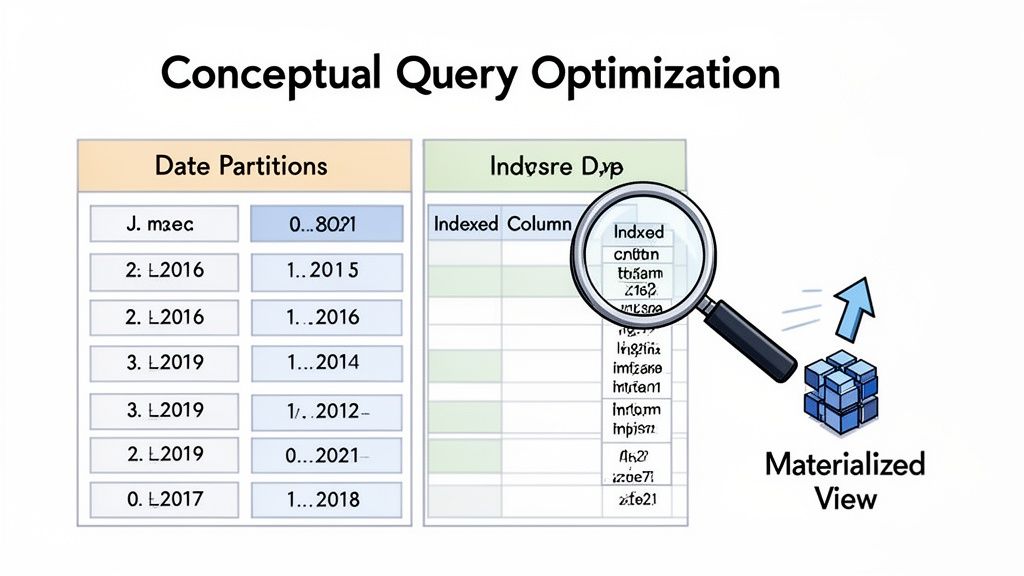
- Indexing: This creates a lookup table that the database search engine can use to speed up data retrieval. Instead of a full table scan, the engine uses the index to find rows quickly. This is effective for queries that filter on specific columns like
account_idoruser_id. - Partitioning: This divides a large table into smaller pieces based on a column, most commonly a date. When a query filters on that partition key, the database engine only scans the relevant partitions. This process is called "partition pruning" and dramatically reduces scan time and cost.
- Materialized Views: These are pre-computed tables that store the results of a query. Instead of running a complex aggregation every time a dashboard loads, the system can query the materialized view. This is ideal for pre-aggregating metrics like daily active users.
Pro Tip: Always discuss the trade offs. Indexing and materialized views consume storage and require maintenance, adding overhead to data loading. Your ability to weigh the costs versus the benefits is what interviewers look for.
To stand out, explain how you would use a query execution plan to find performance bottlenecks before applying these optimizations. For advanced interview prep, explore the top 10 Snowflake interview questions, as many platform specific questions cover optimization. Understanding the modern data stack is also crucial.
7. What are the Differences Between OLTP and OLAP? When Would You Use Each?
This conceptual question tests your understanding of fundamental database designs. An interviewer asks this to see if you grasp why data warehouses exist and how their architecture is built for analytics. A clear answer connects theoretical knowledge to practical business needs.
Both are types of database processing, but they serve different functions. OLTP supports daily business operations, while OLAP powers business analysis and decision making.
Key Differences: Transactions vs. Analysis
The core distinction is their primary function: processing transactions versus enabling analysis.
- Online Transactional Processing (OLTP): These systems are the engines of a business. They process a high volume of short transactions in real time, like a banking app processing a withdrawal. The priority is write heavy operations (
INSERT,UPDATE,DELETE), data integrity, and speed for many concurrent users. Data is typically stored in a highly normalized structure. - Online Analytical Processing (OLAP): These systems are built for complex queries on large volumes of historical data. An analyst uses an OLAP system to ask questions like, "What were our total sales by product category for the past three years?" The priority is fast read performance for complex aggregations. Data is stored in denormalized structures like star or snowflake schemas.
Pro Tip: Use a simple analogy. Explain that OLTP is like a bank teller handling individual deposits quickly. OLAP is like the bank's financial analyst studying years of transaction data to find trends. This makes the concept easy to understand.
To impress your interviewer, discuss how the ETL process acts as the bridge, moving and reshaping data from OLTP sources for OLAP systems. You can also mention modern trends like HTAP (Hybrid Transactional/Analytical Processing). For more practice, reviewing data engineering interview questions can be helpful.
8. Describe Your Experience with Data Quality. How Do You Identify and Resolve Data Quality Problems?
This is a critical behavioral question. Interviewers ask this to assess your real world problem solving skills. They want to know if you can systematically diagnose and prevent data integrity issues.
Data quality refers to the accuracy, completeness, and reliability of data. In a data warehouse, poor data quality leads to flawed analysis, incorrect reports, and a loss of trust from stakeholders. A strong answer will detail a specific scenario where you tackled a data quality challenge.
A Systematic Approach to Data Quality
A robust answer shows a structured process for handling data issues. This involves fixing the immediate problem and preventing it from happening again.
- Identification: The first step is detecting the issue. This can happen through automated validation checks, monitoring dashboards that flag anomalies, or reports from business users who notice something is wrong.
- Resolution: Once identified, the process involves root cause analysis. For example, you might find duplicate transactions in a sales table. You trace this back and find the source system has a retry logic that creates duplicates. The resolution would be to implement deduplication logic in the ETL process before data is loaded into the warehouse.
Pro Tip: Use the STAR method (Situation, Task, Action, Result) to structure your answer. Describe the specific data quality situation, the task you were assigned, the actions you took (including tools like SQL or Python), and the measurable result of your work, such as "improved report accuracy by 15%."
To stand out, emphasize how you communicated with source system owners and business stakeholders. Showcasing your collaboration and prevention strategies is just as important as the technical fix. For more examples, you can review common data analyst interview questions.
9. How Would You Design a Data Warehouse for a Specific Industry?
This situational question tests your end to end design thinking. Interviewers use it to assess your ability to translate business needs into an architectural plan. Your logical, step by step process is more important than a single "correct" answer.
A strong response shows you can turn business requirements into a technical blueprint. It proves you are an architect who understands how data drives business value.
Key Steps in the Design Process
Structure your answer around a clear, logical methodology like the Kimball methodology, which focuses on business processes.
- Step 1: Gather Business Requirements: The first step is to understand the business. What key performance indicators (KPIs) matter? What questions do stakeholders want to answer? For an e-commerce company, this might be "What is our customer lifetime value?"
- Step 2: Identify Business Processes & Granularity: Based on requirements, identify the core processes to model, such as sales or inventory. Define the granularity of your fact tables. For a sales fact table, will a single row represent an individual order line item or a daily product summary?
- Step 3: Dimensional Modeling: Identify the dimensions (the "who, what, where, when, why") and facts (the measurements). For a sales process, dimensions could include
DimCustomer,DimProduct, andDimDate. TheFactSalestable would contain metrics likeSalesAmountandQuantitySold. - Step 4: Choose the Schema: Decide between a star schema (simpler, faster queries) or a snowflake schema (more normalized). Most designs start with a star schema for its simplicity and performance.
Pro Tip: Always start your answer by saying, "First, I would ask questions to understand the business requirements." This shows the interviewer you are a business focused problem solver, not just a technician.
10. What are Common Tools and Approaches for Data Warehousing?
Interviewers ask this question to assess your practical, hands on knowledge of the data warehousing ecosystem. It is about showing you understand the entire data lifecycle and the technologies used at each stage.
This question tests your familiarity with the modern data stack, which includes a range of tools for ingestion, transformation, storage, and business intelligence. Showing you understand how these components fit together is crucial.
Key Tools and Processes
The modern data warehouse relies on a suite of specialized tools. Your answer should touch upon the major categories and provide specific examples.
- ETL/ELT and Orchestration: This covers getting data into the warehouse and managing workflows. Tools like Fivetran or Airbyte are popular for ingestion. Workflow orchestration tools like Apache Airflow or Dagster are used to schedule and monitor data pipelines.
- Transformation: Once data is in the warehouse, it needs to be cleaned and modeled. dbt (Data Build Tool) has become the industry standard for transformation, allowing analysts to transform data using SQL.
- Data Warehouse Platforms: This is the core storage and compute engine. Key players include cloud platforms like Snowflake, Google BigQuery, Amazon Redshift, and Databricks.
- Business Intelligence (BI): These are the front end tools that business users use to visualize data. Common examples include Tableau, Power BI, and Looker.
Pro Tip: Do not just list tools. Structure your response around a project. For example: "We used Fivetran to ingest Salesforce data into Snowflake. Then, we used dbt to build our dimensional models, orchestrated with Airflow. Finally, our business teams used Tableau dashboards to consume this data."
A well rounded answer demonstrates both high level architectural understanding and practical tool experience. For more guidance on aligning your skills with job requirements, learn how to tailor your resume for specific data roles and highlight the most relevant tools.
10-Point Comparison: Data Warehouse Interview Questions
Turn Your Interview Preparation Into a Job Offer
Navigating data warehouse interview questions requires more than memorizing definitions. It demands a practical understanding of how data architecture, modeling, and optimization drive business intelligence. A successful interview hinges on your ability to connect foundational concepts like star schemas with real world business scenarios.
Your goal is not just to answer questions correctly but to demonstrate a problem solving mindset. When an interviewer asks you to explain the ETL process or discuss data quality, they are evaluating your thought process. They want to see how you approach challenges and implement robust solutions. Your ability to articulate the trade offs between different SCD types or explain query optimization techniques showcases your expertise.
Your Strategic Next Steps
True preparation involves translating your knowledge into a compelling narrative that highlights your value. Successful candidates can tell a story with their experience, using specific examples to illustrate their skills. Think back to a project where you had to troubleshoot a slow query. Frame that experience using the STAR method (Situation, Task, Action, Result) to create a powerful, evidence based response.
Consider these actionable steps:
- Create a Project Portfolio: For each key concept, find an example from your past work or a personal project. Document how you applied your knowledge to achieve a specific outcome. This builds a library of ready to use examples for your interviews.
- Practice with a Peer: Conduct mock interviews with a colleague or mentor. Focus on articulating your thought process out loud, especially for design questions. This helps refine your communication and builds confidence.
- Analyze Job Descriptions: Before each interview, review the job description. Identify the key tools (e.g., Snowflake, dbt) and methodologies mentioned. Tailor your answers to align with the company’s specific needs and technology stack.
Your success in a data warehouse interview is a direct reflection of your ability to connect technical concepts to business impact. Whether you are discussing the differences between OLTP and OLAP systems or explaining your preferred data modeling approach, always bring it back to how your work supports better decision making. This business centric perspective is what separates a good candidate from a great one.
Mastering these data warehouse interview questions is a critical step, but your resume must first get past automated filters to land you that interview. Use Jobsolv’s free, ATS approved resume builder to create a resume that effectively highlights your data warehousing skills and experience. With a powerful, tailored resume in hand, you are fully equipped to navigate the hiring process and secure the remote data analytics role you deserve. Start building your winning resume with Jobsolv today.


